for Better Correlation of Human Inspection Data to (NIST Traceable) Referee Level Particle Standards
The test parameter that has made possible replicable measurements of the incidence of visible contaminating particles is the detection probability of identified sealed containers. Since this measurement uses the probabilistic response of human beings, accurate replicable measurements requires the mean of many responses. Although the basic measurement parameter is Probability of Detection, a broadly determined calibration curve which relates particle detection probability to the maximum dimension of a particle, provides a more desirable production control measurement. This conversion also provides a traceable connection between visible particle contamination measurements and the National dimension standards maintained by the National Institute of Science and Technology (NIST). Such a dimensionally stable set of single seed particles of know sizes in containers is available from Phoenix Imaging.
The accumulation of data from multiple inspection sites collected under well-defined conditions will generate a truly standard national curve which can assure that visible particle contamination data can precede beyond comparison of results to their correlation. This standard curve will provide an essential transportable standard with which the incidence rate of visible contaminating particles in sealed containers of injectable products can be harmonized.
This full document can be downloaded from the link provided but it is necessary to receive a key to open the document. You can request the key by calling the Phoenix Imaging office or applying for one via email.
The complete Optimizing the Inspection Environment for Better Correlation of Human Inspection Data to (NIST Traceable) Referee Level Particle Standards document.
Excerpts from the Poster Presentation follow:
 generated at 550 foot-candles illumination") The Human Response Curve (HRC) is defined as a plot of the Probability of Rejection for a single particle of a specific size when viewed in an inspection volume with a specific light intensity. This simple measurement of the size of visible particles in sealed containers was finally linked to national dimensional standards. This means that the basis for use of any visible particle inspection method or device can now be firmly linked to the standards maintained by the National Institute of Standards and Technology. The uniformity of the inspection volume is critical to development of this curve. If the light intensity in the inspection volume is not consistent, then the data will not be replicable. The shape of a typical HRC is shown in the figure below, it is mathematically represented as a Sigmoid curve. The curve whether generated theoretically or empirically have similar shape.
The Human Response Curve (HRC) is defined as a plot of the Probability of Rejection for a single particle of a specific size when viewed in an inspection volume with a specific light intensity. This simple measurement of the size of visible particles in sealed containers was finally linked to national dimensional standards. This means that the basis for use of any visible particle inspection method or device can now be firmly linked to the standards maintained by the National Institute of Standards and Technology. The uniformity of the inspection volume is critical to development of this curve. If the light intensity in the inspection volume is not consistent, then the data will not be replicable. The shape of a typical HRC is shown in the figure below, it is mathematically represented as a Sigmoid curve. The curve whether generated theoretically or empirically have similar shape.
The Human Response Curve illustrated in Figure 1 represents the characteristics of a typical inspector with 20/20 near vision when using 550 foot-candle illumination intensity in the inspection volume. The curve has a familiar “Sigmoid” shape with a nearly linear portion in the Knapp “Gray Zone”. In order to generate such a curve, the Referee Level Particle Standards (RLPS™) must extend both below the “Gray Zone” into the “Accept Zone” and above the “Gray Zone” into the “Reject Zone”. The finer the spacing of the particle sizes the more accurate will be the generation of the Human Response Curve. It is important that the particle size distribution in the transition region between the “Gray Zone” and the “Reject Zone” be closely spaced. At Phoenix Imaging we believe that the center of the RLPS™ sets particle distribution should be in this region. The particle size separations in this region of interest should be no more than 15µm, preferably 10µm. As mentioned in the article “Referee Level Particle Standards (RLPS™) Preparation” by Gerald Budd, the particles in this region must be spherical in shape so as to eliminate the “orientation factor”. The “orientation factor” refers to the fact that the apparent size of spherical particle remains constant regardless of the particle orientation, whereas the apparent size of a non-spherical particle is dependent on the orientation of particle at the time of viewing. The end result of this observation is that the Probability of Rejection (PR) of a spherical particle is more consistent than that of a non-spherical particle; therefore only spherical particles should be considered for the generation of the Human Response Curve.
Uniformity of light in the inspection volume is very important
The shape and location of the Human Response Curve is dependent on a number of factors. One of the most important is the Intensity of Illumination within the inspection volume. The light intensity must remain nearly constant in the inspection volume in order to generate a well-defined HRC. A common characteristic of an inspection volume that is not well controlled is a very large error bars surrounding data of each particle size. This will generate a thick HRC that resembles an envelope rather than a line. The information presented here was obtained using a lighting booth with a large uniform inspection volume. In order to obtain an accurate HRC several variables must be controlled: 1) the light intensity must be consistent in the inspection volume; 2) the inspection volume must be larger than volume of the container under inspection, 3) any variation in container position must be within the inspection volume. This set of requirements might appear as an obvious for people involved in this field of study. However, upon careful mapping of the inspection volumes of the most common inspection apparatus, it was found that the inspection volumes or container position did not always meet these criterions.
The inspection volumes were determined in four different inspection booth configurations: the MIB-200™, the MIB-150™, the common dual 40 watt lamp top lighting configuration and the common dual 14 watt lamp top lighting configuration. All of the light booths used the typical Black/White background configuration or some variation of it and the same NIST traceable light meter for the measurements.
Dual-Sided Lighting Inspection Booths
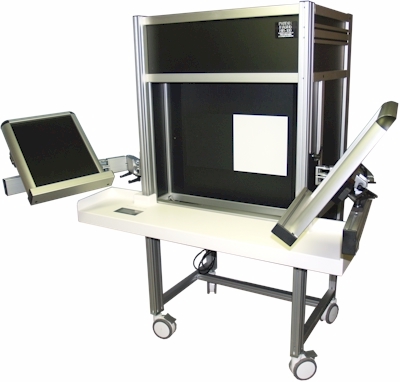 The MIB-200™ uses four lamps in a patented dual sided illumination system in which 2 lamps illuminate the inspection volume from above and 2 lamps illuminate the inspection volume from below. This unique push-pull lighting technique provides a consistent illumination field inside the inspection volume. As one moves further from one of the light sources, they move closer to the opposite light source. The MIB-150™ design concept is similar to that of the MIB-200™ except that the illumination sources approach the inspection volume of the left and right sides. Both the MIB-200™ and MIB-150™ have the additional advantage in that precision feedback control power supplies ensure that each light source maintains a constant lamp output for extended periods. The model MIB-200™ with Adjustable Side Shelves is shown in the Figure below. This is the configuration booth with the standard Black/White inspection background.
The measurement technique used for the evaluation of the inspection volume is an Extech EA33 light meter with a current NIST calibration certification. The light meter was positioned in a plane directly below the centerline of the lamps, i.e. a plumb was dropped from a midpoint between the lamps. The calibration fixture with graduation markings was used to support the light meter head so that is was centered on the measurement plane. If the inspection booth had the light source(s) only above the inspection volume the light meter was oriented with the head (sensor side) facing the light source. In the case of the MIB-200™ and MIB-150™ the light reading is additive and the light meter must be repositioned to face each light source for a accumulative reading at each measurement point. The data was recorded as Lux with millimeter displacement scale or as foot-candles with an inch displacement scale. The results of the investigation are visually understood and conversion between the two systems is simple. The light intensity measurements were recorded at the normal operating level in the user’s facility and no attempt was made to make them equal. The uniformity of the inspection volume is independent of the level as a change in intensity will simply raise or lower all corresponding measurements. The purpose of the exercise was to determine the uniformity of the inspection volume at fixed light output.
The MIB-200™ was found to have the largest of the inspection volumes for the various configurations tested. The MIB-200 Light Intensity Map illustrates the light intensity values at each of the measurement points and a gently rolling surface is observed. The light intensity increases as you approach the light sources on the top and bottom of the booth. There is a large uniform region in the center of the booth with variance of ±5% that extends from -3 inches left of the vertical centerline and +5 inches to the right of the centerline and +3 inches above the horizontal centerline and -3 inches below the horizontal centerline. For a full description of the Light Intensity Maps for all of the configuration evaluated please download the full paper from the 2013 PDA Visual Inspection Forum.
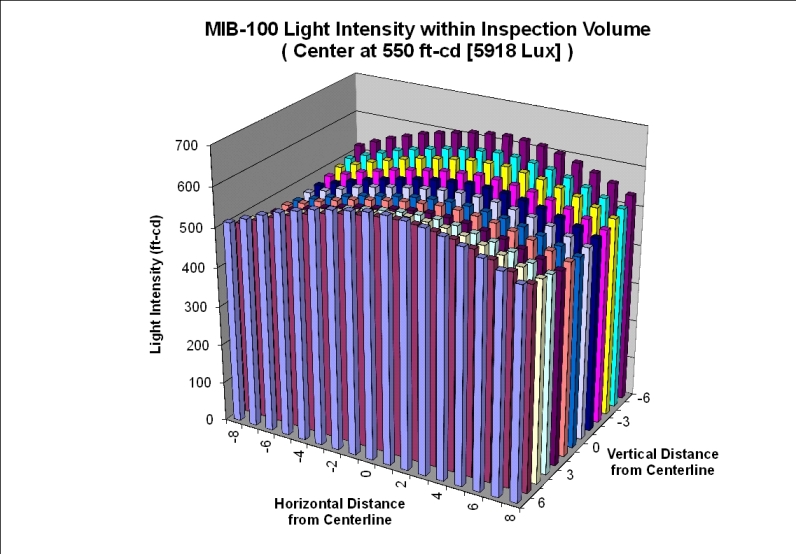
Phoenix Imaging MIB-100 / MIB-200 Light Intensity Map
If one plots the light intensity as a function of displacement from the center (horizontal and vertical, depth is constant) of the inspection volume you can get a graphical representation of the lighting uniformity. The light uniformity is important because the Probability of Rejection is directly related to light intensity. If the goal is to improve the inspection repeatability of a group of inspectors then one should concentrate on providing them a better inspection environment in which the light intensity will remain as consistent as possible.The characteristic shape of the inspection volume found in the MIB-200™ has a slight bump in the center. The center of the booth aligns with the center of the lamps and produces the highest intensity. As one moves from the center of the booth toward the lamps in either direction (up or down) the intensity also increase slightly (about 700 ft.-cd max.) The rate of change in the horizontal directions is even less. The effective inspection volume for the MIB-200™ (similar inspection volumes for the MIB-180™ and MIB-190™, both have top/bottom lighting systems) is over 5 liters in which the light intensity remains within ±5% of target intensity and 10 liters in which the light intensity remains within ±10% of the target value.
This is important because it determines the size of the container that can be inspected within the inspection volume and produce repeatable inspection results from your core group of inspectors. It should be noted that this volume covers both the “White” and “Black” background regions. Each region will have about 2.5 liters of volume, just large enough to handle a 1 liter container. It is important that the light intensity is the same at the top and the bottom of the container if you want to have the same Probability of Rejection.
The MIB-150™ also uses a parallel lighting technique but the light enters the inspection volume for the left and right side rather than the top and bottom. It produces a Light Intensity Map that is rotated 90° from the MIB-200™ inspection booth. This unit is table and is better utilized for the inspection of containers less than 50 ml in volume. This is because many inspection procedures will invert the container as part of the inspection hold the container nearly vertical. The vertical orientation will reflect the side lights on the container surface obscuring a small portion of the contents. Please see full article for MIB-150™ Light Intensity Map and Intensity Data. It is sufficient to indicate that the MIB-150™ Manual Inspection Booth has a large inspection volume that is only second to that of the MIB-200™.
Light Intensity verses Displacement from single-side light source
Single-Sided Lighting Inspection Booths
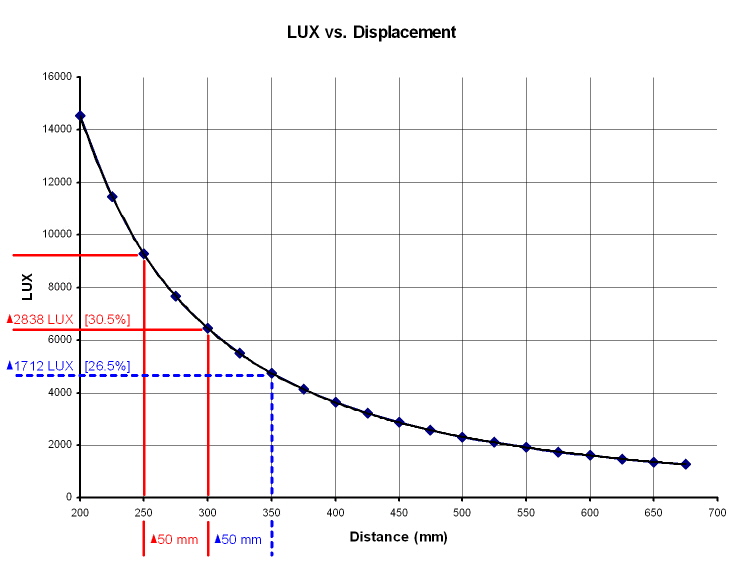
The typical inspection booth found in the pharmaceutical industry was a design that was first used over 60 years ago. The design utilizes a pair of lamps that are usually rated at 15 watts to 40 watts each. The intensity is directly proportional to the wattage used but the shape of the light intensity map is same regardless of the lamp intensity. The physics of the problem is really quite simple, the light intensity decreases as a function of distance from the light source. This produces what is referred to as a “Classical Waterfall” shape associated with all single-sided illumination systems. As can be observed in the diagram to the right that a small displacement from the light source can results in a significant change in the light intensity. The best method to minimize this change is to perform the inspection further away from the light source. However, it has been demonstrated numerous times that human inspectors tend to “move toward the light” in order to “see the contamination better”. This practice demonstrates the reason that inspection results are not statistically equivalent when using the single-side inspection booth.

Light Intensity Map of Single-Sided Lighting Booth
If the goal is to generate a Human Response Curve that is representative of the company’s inspection capability then the use of this technology should come into question. The Light Intensity Map of the Single-Sided Lighting Environment illustrates the problem of finding a “uniform light intensity region”. The figure to the left illustrates the typical intensity map found in this type inspection booth. This example shows the intensity map for a pair of 40 watt (T-12) lamps mounted above the White/Black inspection background. The light intensity changes rapidly with a small vertical displacement from the lamps. The diagram indicates that a vertical displacement of 1 inch (25 mm) will generate a light intensity change of more than 10%. Which means that this system is only marginally acceptable of containers that are less than 1 inch (25 mm) in overall height. This implies that every inspector in the core team will hold the container in exactly the same location for every inspection. It is unreasonable to expect that such rigid inspection criteria could be met.
When attempting to determine a Human Baseline for Inspection of product the Quality and Engineering teams should have a good understanding of what is involved in entire process. Often the inspection environment is overlooked and it is assumed that what has been used in the past is “Good enough” whereas the selection of an inferior inspection environment may prevent the team from obtaining any meaningful results. Consistent inspection results do not just happen they must be designed into the program and an inspection environment that has a large uniform inspection volume not only make the results more consistent but it also make the inspector job much easier by reducing the physical fatigue.